The Average NCAA Softball Player vs. The Power Four Conferences
What are the trends and key differences heading into the postseason?

There are nationwide averages for softball players, and then there are conferences that, as a whole, blow those averages out of the water to become THE place for players with a certain skill set. Some Power Four conferences often crack the ball out of the park, while others make scoring incredibly difficult. Each Power Four conference has an edge that will make them competitive come the NCAA tournament, where teams will have a chance to play competition outside of their conferences. Let’s look at the average NCAA softball player and how that compares to the averages within the major conferences.
The NCAA Average D1 softball player
Batting Average: Number of hits divided by the number of at-bats, or the likelihood of getting a hit as a percentage.
NCAA Batting Average: .284
Walk percentage: Percentage of at-bats that result in a walk or base on balls (BB).
NCAA Average Walk Percentage: 12%
Strikeout Percentage (K): Percentage of at-bats that result in a strikeout.
NCAA Average Strikeout Percentage: 16.4%
Strikeout Looking (KL): Number of strikeouts where the batter did not swing at strike three, and the corresponding percentage of at-bats.
NCAA KL percentage: 4.4%
SEC
Batting Average: .319
Walk Percentage: 15.4%
Strikeout Percentage: 14.5%
Strikeout Looking: 761 (4%)
The SEC is a hitters conference through and through, the only conference where a batter is more likely to walk than strike out. Despite having 2,000 fewer at-bats than the ACC, the SEC has the second most home runs at 835. More than half of the top 10 teams in the RPI are held by SEC teams, with No. 3 Oklahoma and No.2 Florida leading all SEC deep bombers. The threat of big bats correlates to the increased walk rate in the SEC, as pitchers have to paint away from hitters’ wheelhouses. All offense, all the time, the SEC has the most stolen bases of any Power conference as well. Complete with Stolen Bases, Free Bases, and Trips around the bases, if you want to see hitting, watch SEC Softball.
Big Ten
Batting Average: .305
Walk Percentage: 12.8%
Strikeout Percentage: 17.1%
Strikeout Looking: 899 (5%)
If the SEC is the hitter’s conference, then the Big Ten is the pitcher’s conference. It’s also the largest conference, having played more games with more at-bats by a comfortable margin. Hitters are striking out ~3% more often, despite getting a hit a respectable three of every ten plate attempts. The Big Ten still has its stars at the plate, Ohio State leads the NCAA in home runs, like star sophomore Jasmyn “Jazzy” Burns. The Big Ten owns the second-highest walk rate of the Power 4 conferences, which keeps hitters hopeful. However, they’re number one in hitters with broken hearts, as Big Ten batters are more likely to strike out looking than any other conference. Blessed with depth, power, contact, and quality pitching, the Big Ten has a bit of everything and more than everyone else.
ACC
Batting Average: .311
Walk Percentage: 12.6%
Strikeout Percentage: 15.2%
Strikeout Looking: 716 (3%)
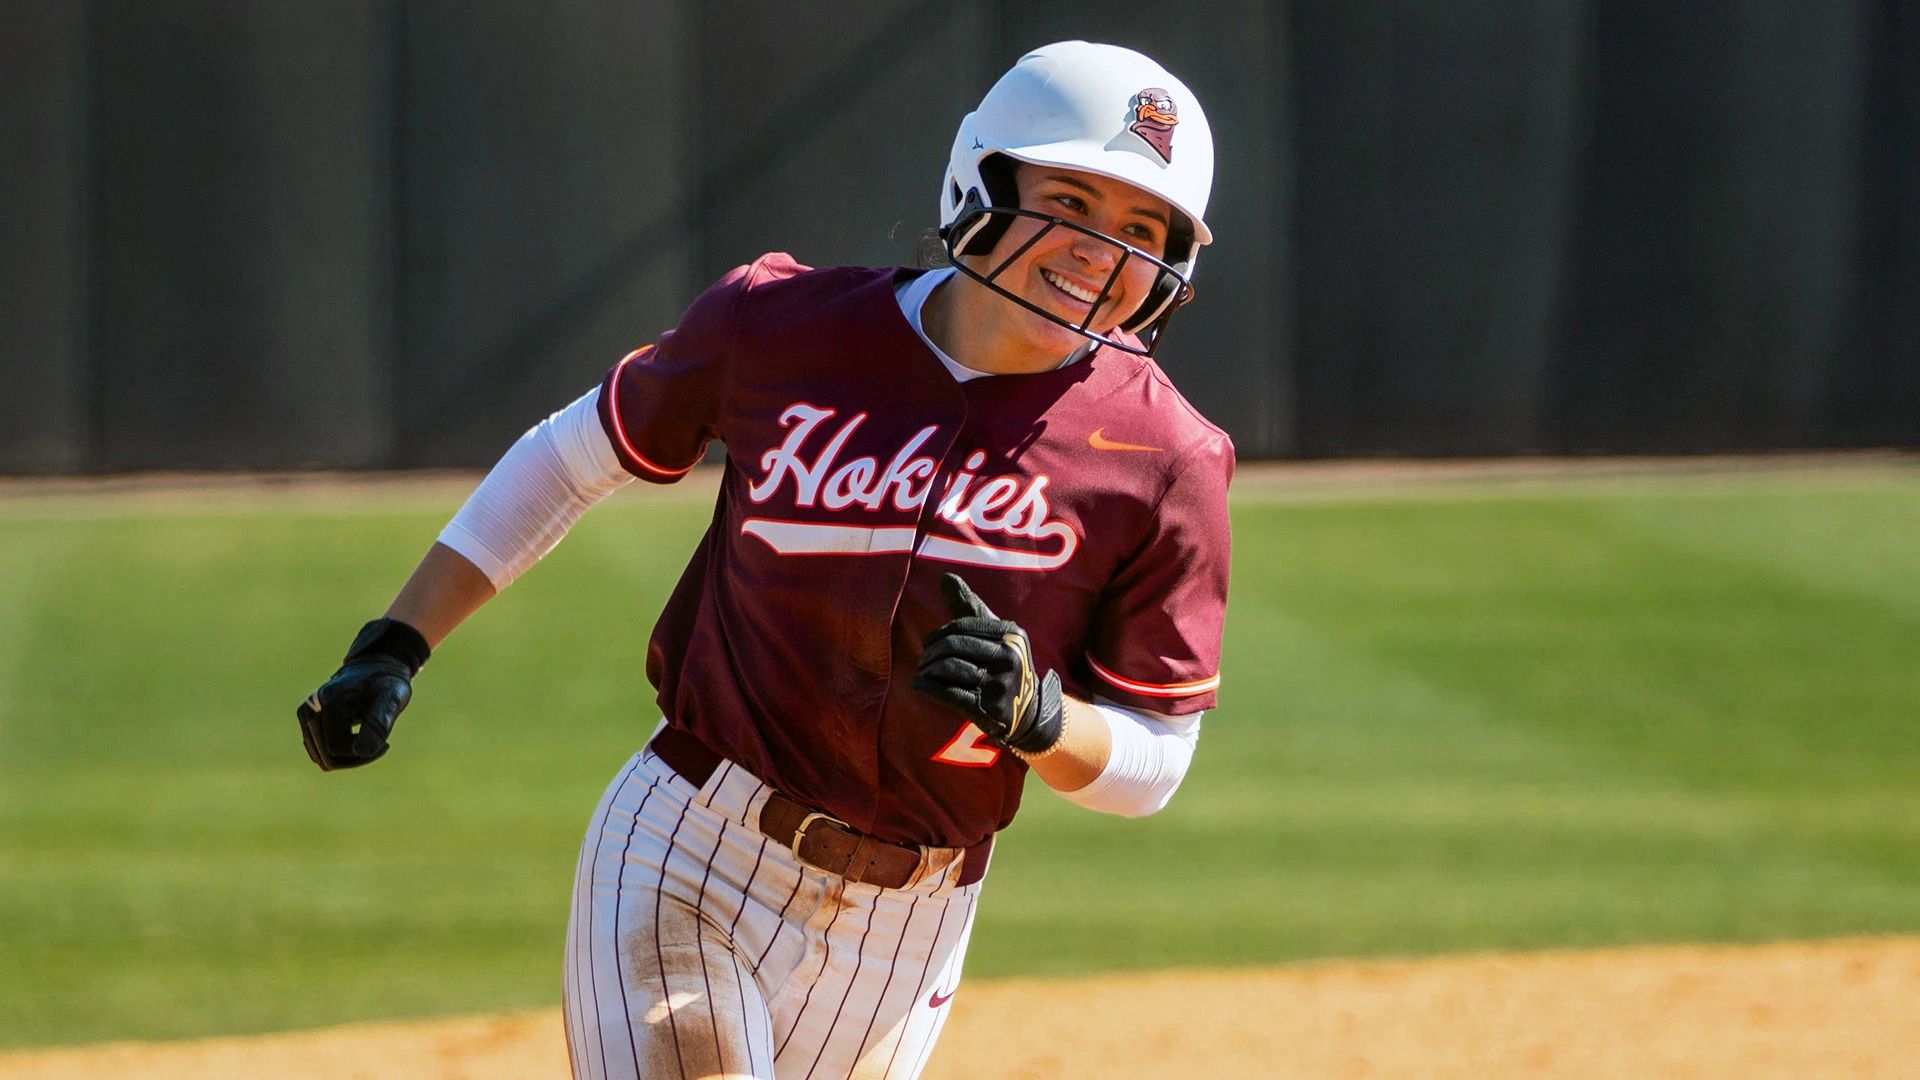
ACC Pitchers have to earn their strikeouts. While their Big Ten compatriots can expect 5% of their batters to watch their fate, that likelihood for ACC defenses is nearly cut in half. The ACC is home to the current home run leader, senior Cori McMillan, whose 25 Home runs make up more than a quarter of Virginia Tech’s 96 on the year. Stay alert when the ball is put in play, as ACC teams are the most likely of any Power Four conference to hit a triple. Base runners and would-be thieves need to stay alert as well, as ACC catchers have caught the same number of runners stealing as SEC catchers, despite the SEC having nearly 300 more attempted steals. With fewer runs and a smaller top tier, the ACC is a balanced, tough scrap.
Big 12
Batting Average: .298
Walk Percentage: 12%
Strikeout Percentage: 15.6%
Strikeout Looking: 518 (4%)
The Big 12 has the fewest teams of the Power 4 conferences, having played fewer games than the Missouri Valley and the Sun Belt conferences. Hitters aren’t smashing the ball the same way, as the other three conferences have more home runs than games played. Neither are the pitchers extremely dominant with a huge volume of strikeouts. The Big 12 is the conference to watch for defense, as Big-12 pitchers force a higher rate of groundouts than any of the other top leagues. Arizona is the top-ranked Big 12 team, spurred on by a .353 Batting average, which places them in the top 10 across the NCAA. Other Big 12 teams like Texas Tech are keeping up by having one of the five lowest earned run averages from their pitching. While pitchers and sluggers duel in the other conferences, Big 12 teams scrap it out with singles, grounders, and consistency.
As the regular season is winding down and teams play their final series, these stylistic differences set up exciting inter-conference clashes. Will the SEC’s big swing hold up against Big Ten pitching? Will the Big 12 be fresher than their competitors during the final stretch? This tracing doesn’t even include great Mid-Major teams like Marist, which are dominating in their own right. The College World Series champion could truly be from anywhere.